Units / UNIT-04
SIGNAL
Live dashboards that turn data into decisions.
SIGNAL pulls your numbers into one live view, tells you when something moves and lets you share the picture with the team.
- Unit
- UNIT-04
- Drg
- CP-U04 · Rev A
- Class
- Business
- Status
- Setup on request
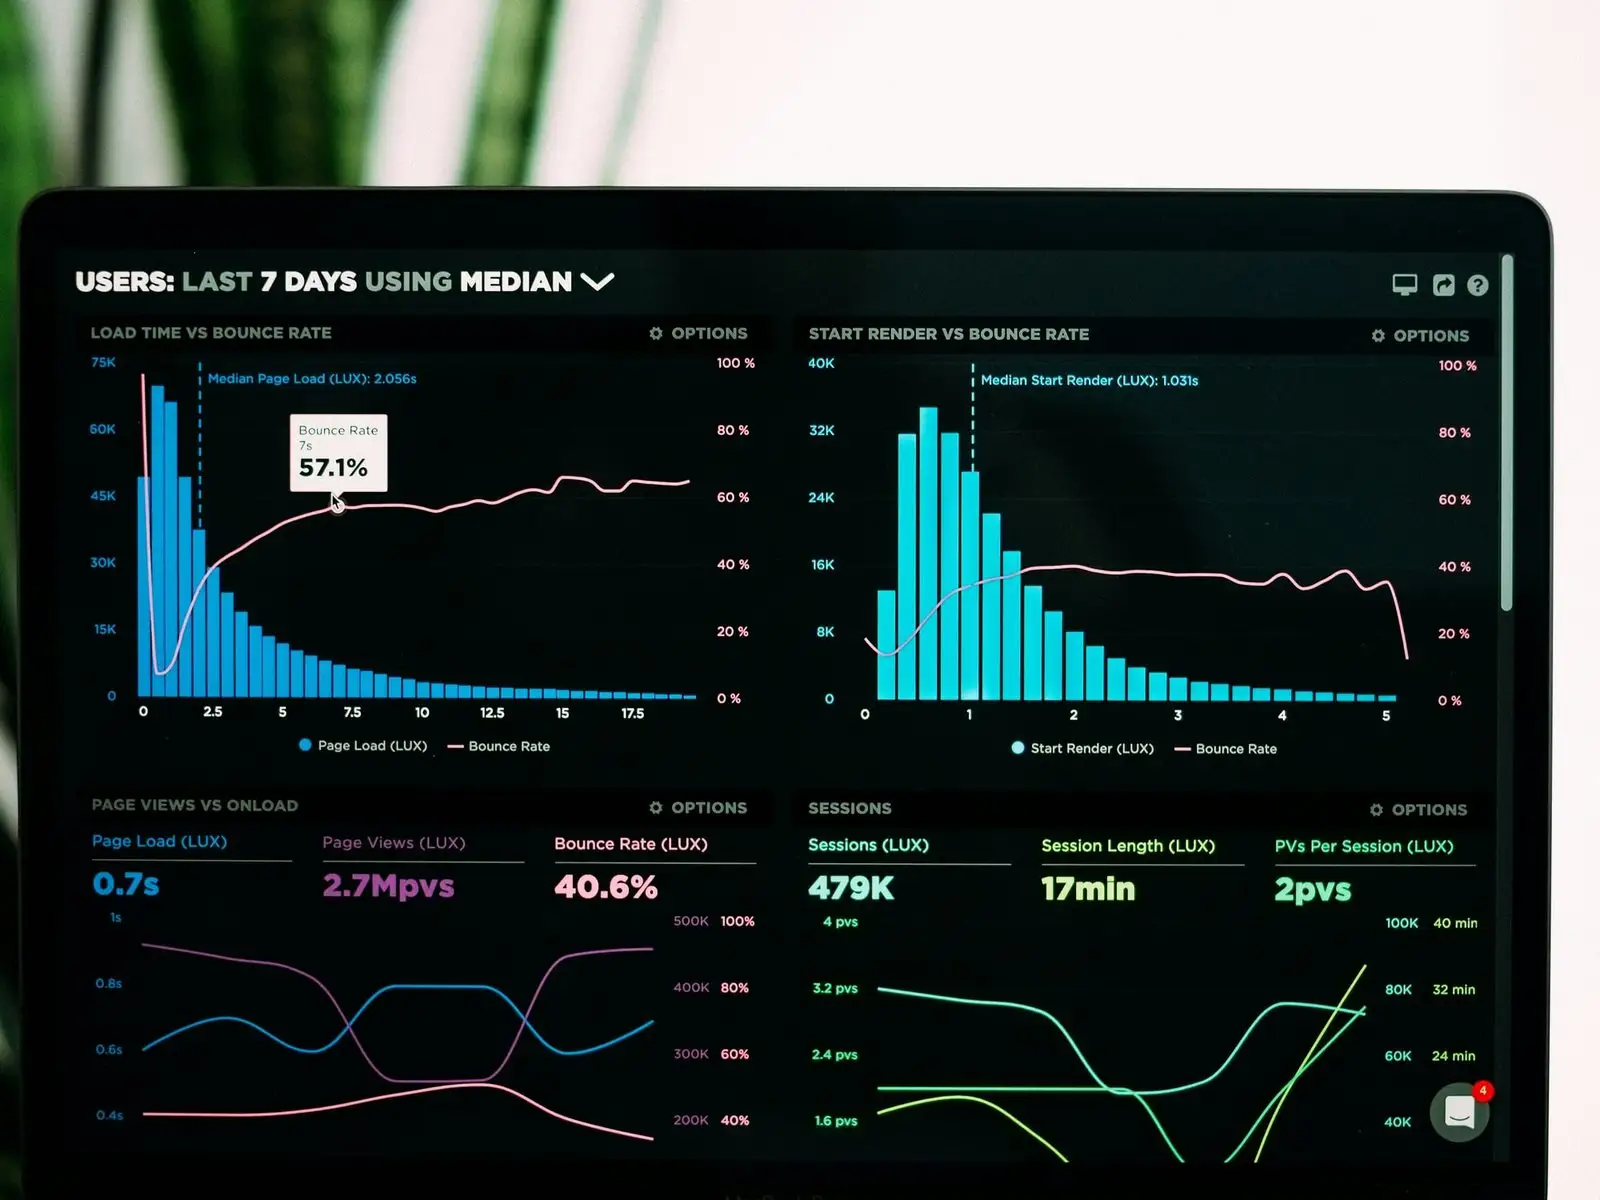
Live data from your sources · Alerts when numbers move · Shareable views for the team
01 · The problem
The problem it solves
Your numbers live in spreadsheets, exports and other people's inboxes. By the time a report is ready, it is already out of date.
You find out something moved days after it happened, and people argue about which version of the figures is right.
SIGNAL puts the numbers you care about on one live page. You choose which ones matter, you see them as they change, and the team looks at the same picture instead of its own copy of a spreadsheet.
02 · What it does
What SIGNAL does
- Connects to the places your data lives
- Shows it live on one dashboard
- Alerts you when a number moves
- Shares views with your team
03 · Who it is for
Who it is for
Teams who make decisions from spreadsheets and exports and would rather watch the numbers update themselves.
A good fit if
- You review the same figures every week
- More than one person needs the same view
- You want a heads-up when something changes
- You would like to spot problems earlier
04 · What you get
What you get
Everything here is agreed in writing before work starts.
- A SIGNAL dashboard built around your numbers
- Connections to the sources you choose
- Your first alerts set up
- Views you can share with the team
- A walk-through for your team
- A clear price before we start
05 · How setup works
How setup works
- 01
Scan
A short call about the numbers you check and the decisions they feed. We agree the sources and the first views worth building.
- 02
Configure
We connect your sources, build the dashboard and set your first alerts, then check the figures with you against what you know.
- 03
Launch
We switch SIGNAL on, show your team how to read and share views, and agree who to contact afterwards.
What we need from you
Access to the sources your numbers live in, and the figures you check most often.
How it is priced
Quoted in writing after a free scoping call, before any work starts. It depends on how many sources are connected and how many views you want.
After launch
We agree an aftercare plan before launch, so you know who to contact and what is covered.
06 · Connects to
SIGNAL works with common kinds of tools. We check the details for yours in the scan.
- Spreadsheets
- Accounting tools
- Payments
- Forms
- Messaging
Where does the data come from?
From the places you already keep it, such as spreadsheets and the tools your team uses. We agree the sources in the scan.
Can we get alerts?
Yes. You choose which numbers matter and when you want to hear about a change.
Who can see the dashboard?
You decide. Views can be shared with people on your team, and we agree access with you.
Can it show more than one source on one page?
Yes. Bringing several sources into one live view is the point.
Is SIGNAL only for big teams?
No. A small team with a few important numbers is a good fit. SIGNAL is about seeing them clearly, not about volume.